Course Details
Spring 2022
Clemson University
3 credit hours.
Section 2:
Meeting time to be determined on individual basis.
Location: Meets on Zoom
Instructor Info
Instructor:
Dr. Amanda Regan
aeregan (at) clemson.edu
Pronouns: She/Her
Office Location: Hardin Hall 023
Office Hours: On Zoom. Mondays from 11am-12pm. Wednesdays 10-12pm and by appointment. Make an appointment for Office Hours here.
Course Overview
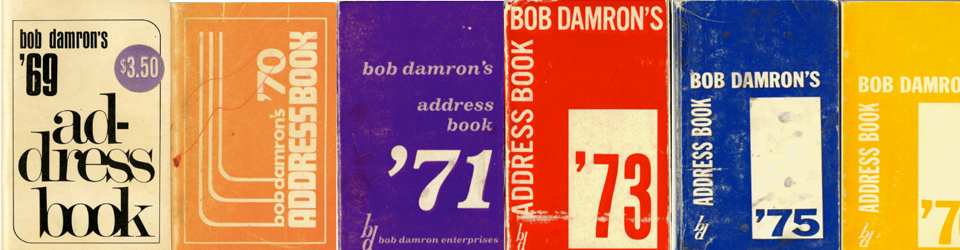
In this creative inquiry course students will work on Mapping the Gay Guides, a digital history project that seeks to digitize LGBTQ guidebooks from the 1960s through the 1990s. While on his frequent business trips around the United States in the late 1950s and early 1960s, Bob Damron wanted to find bars and other locales to meet other men like him. A gay man, Damron sought friends, companions, and safety at friendly businesses in the various cities he visited. He began jotting down the names of the spots he frequented, sometimes loaning out his notebooks to fellow gay friends to take with them on their own journeys. His prolific lists became the basis of gay travel guide he began publishing in 1964.
Named the Bob Damron Address Books, these travel guides became almost survival guides to gay and queer travelers across the United States. First published in an era when most states banned same-sex intimacy both in public and private spaces, these travel guides helped gays (and to a lesser extent lesbians) find bars, cocktail lounges, bookstores, restaurants, bathhouses, cinemas, and cruising grounds that catered to people like themselves. Much like the Green Books of the 1950s and 1960s, which African Americans used to find friendly businesses that would cater to black citizens in the era of Jim Crow apartheid, Damron’s guidebooks aided a generation of queer people in identifying sites of community, pleasure, and politics.
The MGG research team has begun turning the thousands of listings within the guides into usable, functioning data to allow researchers to make connections between historical queer communities. Mapping this data allows us to display the distribution of locations and explore the growth of the queer communities over time. In the U.S. South, for example, you can explore 154 queer spots across twelve state in 1965 to over a thousand locations in those same states by 1980. Damron’s use of letters and symbols to designate certain features of bars (the “B” for “blacks frequent,” for example) allows users to navigate through nuances in queer geography. Mapping the Gay Guides turns the incredible textual documents of gay travel guides into accessible visualizations, useful in exploring change in queer communities over time.
In this class we will focus on international data. In the early years of the guides (1965-1980), many international locations were omitted or, if they were included, they were typically border countries like Mexico and Canada and those listings could be found in the US listings for the closest city. For example, listings from Tijuana would frequently be listed in San Diego which is the closest border city. As the guides grew and as the LBGTQ population increasingly became more visible during the Gay Rights Movement, the number of international locations listed in the guides grew. Our focus this semester is on digitizing this data and attempting to associate geographical coordinates with it so that it can be mapped.
Students will be introduced to the fundamentals of digital history and will learn how to create and curate a historical dataset. They will learn to collect data in an organized and tidy manner and will learnt to use database software to manage, filter, and sort through data. Finally, they will learn to geocode historical data (the process of assigning longitude and latitude coordinates to descriptions of locations) and map it.
Student Learning Outcomes
By the end of the course students should be able to:
- Evaluate the ways historians are currently using computer and database resources for research and presentation
- Be able to create a basic geographic dataset with longitude and latitude
- Make a map using a historic dataset
- Write a blog post detailing this process for a digital history blog
Assignments & Grades
- Data Entry: Over the course of the semester you will complete data entry for international listings from 1965-2000. (60%)
- Geocoding, location research, and map: After you have digitized the data, you will learn and work to identify geographical coordinates for each location. Once you have added geographical coordinates, you will make a map that you can use in writing your reflection. (20%)
- End of the Semester Reflection: At the end of the semester, you’ll write a short reflection about your time on the project that describes what you learned about doing digital history. (10%)
- Participation in Course Meetings (10%)
Grading System
Final grades will follow Clemson’s percentage-based grading scale.
- A: 90-100%
- B: 80-90%
- C: 70-79%
- D: 60-69%
- F: 0-59%
Course Policies
Please note that this syllabus may be updated online as necessary. The online version of this syllabus is the only authoritative version.
- Required Readings: There are no required textbooks for this course. All readings will be available for free online and they will be outlined in canvas.
Schedule
Because our course is project driven, there is no week by week schedule. At our first meeting we will discuss the trajectory of the course and I will provide a project history, overview of the methodology, and train students on how to use database software. While you are digitizing the data we will have check-in meetings via zoom every two weeks at a mutually agreed upon time. Once data digitization is complete, we will meet to discuss the data and learn how to geocode and map it. The final blog post along with your data and map are due May 2nd.